This “problem” is so common there is a website linuxatemyram.com which briefly describes what Linux is doing and why your RAM is not really gone. They have a good explanation there, but I didn’t find any graphs when looking through it, so I decided to run some experiments and graph the results. The code I used for this experiment can be found on my Github: jfritsche1/parse-linux-free.
Experiment Time
What we will end up doing is overloading the memory and watching the changes in the utilization of free, available, and swap memory. We’ll graph the results and discuss what is happening.
House Keeping
- I’ll be using Fedora Linux 38 with 16 GB of memory and 500 GB of disk.
- In the commands that I show below (“^C“) indicates pressing Ctrl+C to kill the current command.
- John-EE:<current-working-directory>$ is the prompt within my terminal
Using Free to Observe Memory
We’ll utilize the free(1) command to view our memory and swap metrics. I’ve used two of the free command’s options.
- -m, –mebi will display the amount of memory in MebiBytes, which is a contraction of Mega binary Byte, 1 MiB = 1024 * 1024 bytes.
- -s, –seconds <delay>, where delay is in units of seconds.
John-EE:parse-linux-free$ free -m -s 1
               total        used        free      shared  buff/cache   available
Mem:           15906        3546        5782         487        6576       11548
Swap:           8191           0        8191
^C
Data Formatting and Capture
To graph the memory values as a time series, the call to free will be piped (“|“) with the command ts(1). The ts command prepends each line of input with a timestamp.
John-EE:parse-linux-free$ free -m -s 1 | ts "%s"
1706852618                total        used        free      shared  buff/cache   available
1706852618 Mem:           15906        2615        6749         351        6541       12619
1706852618 Swap:           8191           0        8191
^C
The output of our test is small, so we can easily capture our data by using file redirection (“>“).
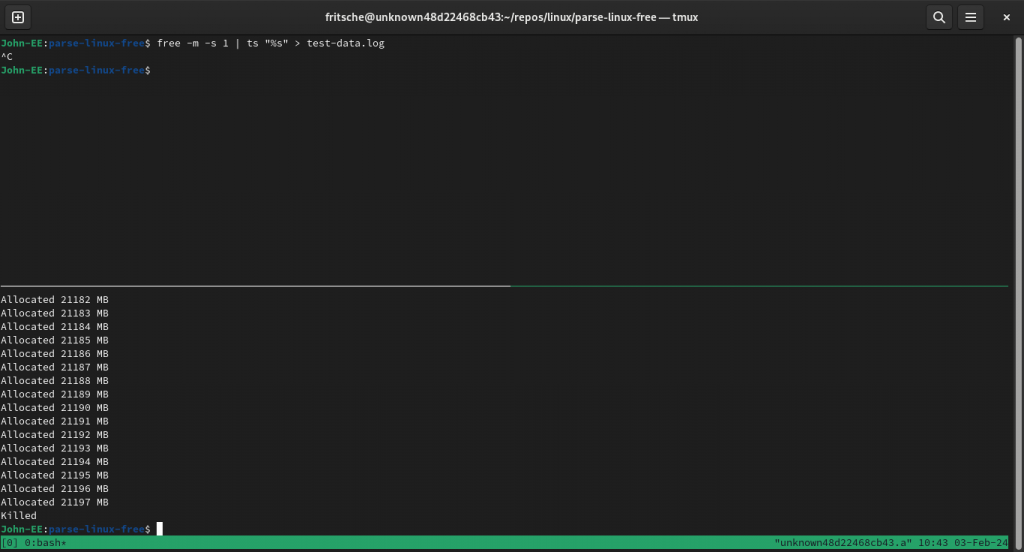
John-EE:parse-linux-free$ free -m -s 1 | ts "%s" > test_data.log
^C
Before running this command we have to create our program that will allocate memory and provide some interesting data.
Allocate Memory
This program allocates 1 MiB of memory up to the maximum amount passed as an argument.
#include <stdlib.h>
#include <stdio.h>
#include <string.h>

int main(int argc, char** argv) {
    int max = -1;
    int mb = 0;
    char* buffer;

    if(argc > 1)
        max = atoi(argv[1]);

    while((buffer=malloc(1024*1024)) != NULL && mb != max) {
        memset(buffer, 0, 1024*1024);
        mb++;
        printf("Allocated %d MB\n", mb);
    }

    return 0;
}
For compiling the program I used GCC.
John-EE:parse-linux-free$ gcc allocate-memory.c -o allocateWhen the program is ran with a large value, it will allocate more memory than what the system can handle. This will cause the process to get interrupted and killed by the OOM Killer.
John-EE:parse-linux-free$ ./allocate 25000
Allocated 1 MB
Allocated 2 MB
...
...
Allocated 20952 MB
Allocated 20953 MB
Killed
John-EE:parse-linux-free$
Data Capture
Time to allocate memory and gather data.
- Start two terminals, one for data capture with free, the other for memory allocation.
- I chose tmux for doing this. I’ve used it for years and enjoy how I can quickly create and move between new panes. It is a really useful tool.
tmux- Ctrl+B, ” (Opens a new panel, split horizontally)
- Use Ctrl+B, o (to switch panes) and Ctrl+B, d (to detach from that session).
- I chose tmux for doing this. I’ve used it for years and enjoy how I can quickly create and move between new panes. It is a really useful tool.
- Run the free command
free -m -s 1 | ts "%s" > test_data.log
- Run the memory allocation executable
./allocate 25000- If you don’t hit the OOM killer then pass a larger number
- After hitting the OOM killer, halt the free command using Ctrl+C

Plotting the results
The parse_linux_free.py code (Available my Github: jfritsche1/parse-linux-free) will read the output of the free command and store it within a Pandas DataFrame. We then plot that output as a time-series line graph.
Setup your virtual environment using pip install of the requirements.txt file.
John-EE:parse-linux-free$ python -m venv test-env
John-EE:parse-linux-free$ source test-env/bin/activate
(test-env) John-EE:parse-linux-free$ pip install -r requirements.txt
.... <Install of requirements into virtual environment happens> ...
Run the parse_linux_free.py with your log file name and the plot or plots-path option. Then check the plots-path folder to see the results of the test.
python parse_linux_free.py test-data.log --plots-path plots
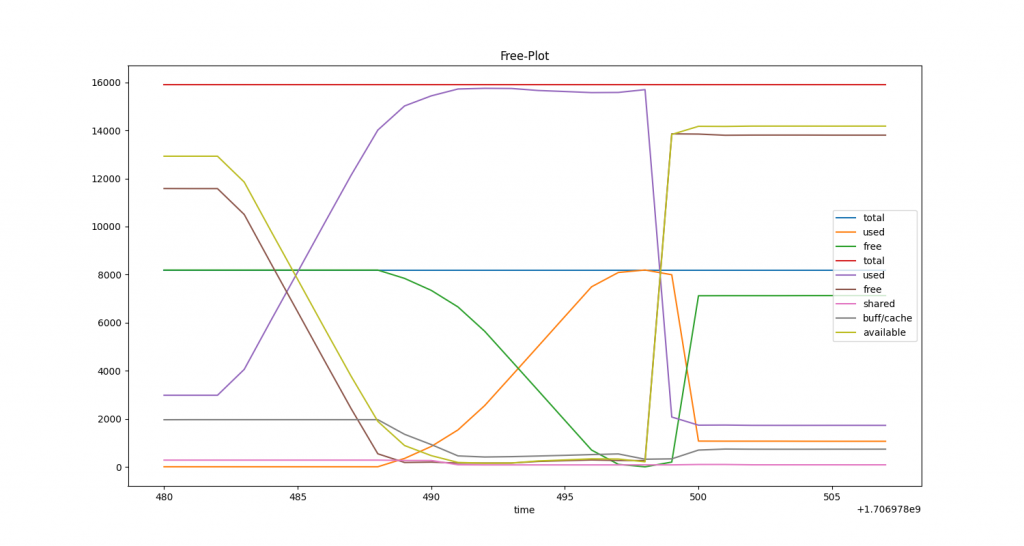
Free and Available memory have an inverse correlation to Used memory. As the process requires more memory, Free and Available memory is allocated to our program’s process and becomes Used memory.
There is much to explore within Linux and this is only the beginning. This fun experiment was a quick way of understanding some aspects of memory management within Linux.

Leave a Reply